User Guide
Jacky's training tools v0.1 beta
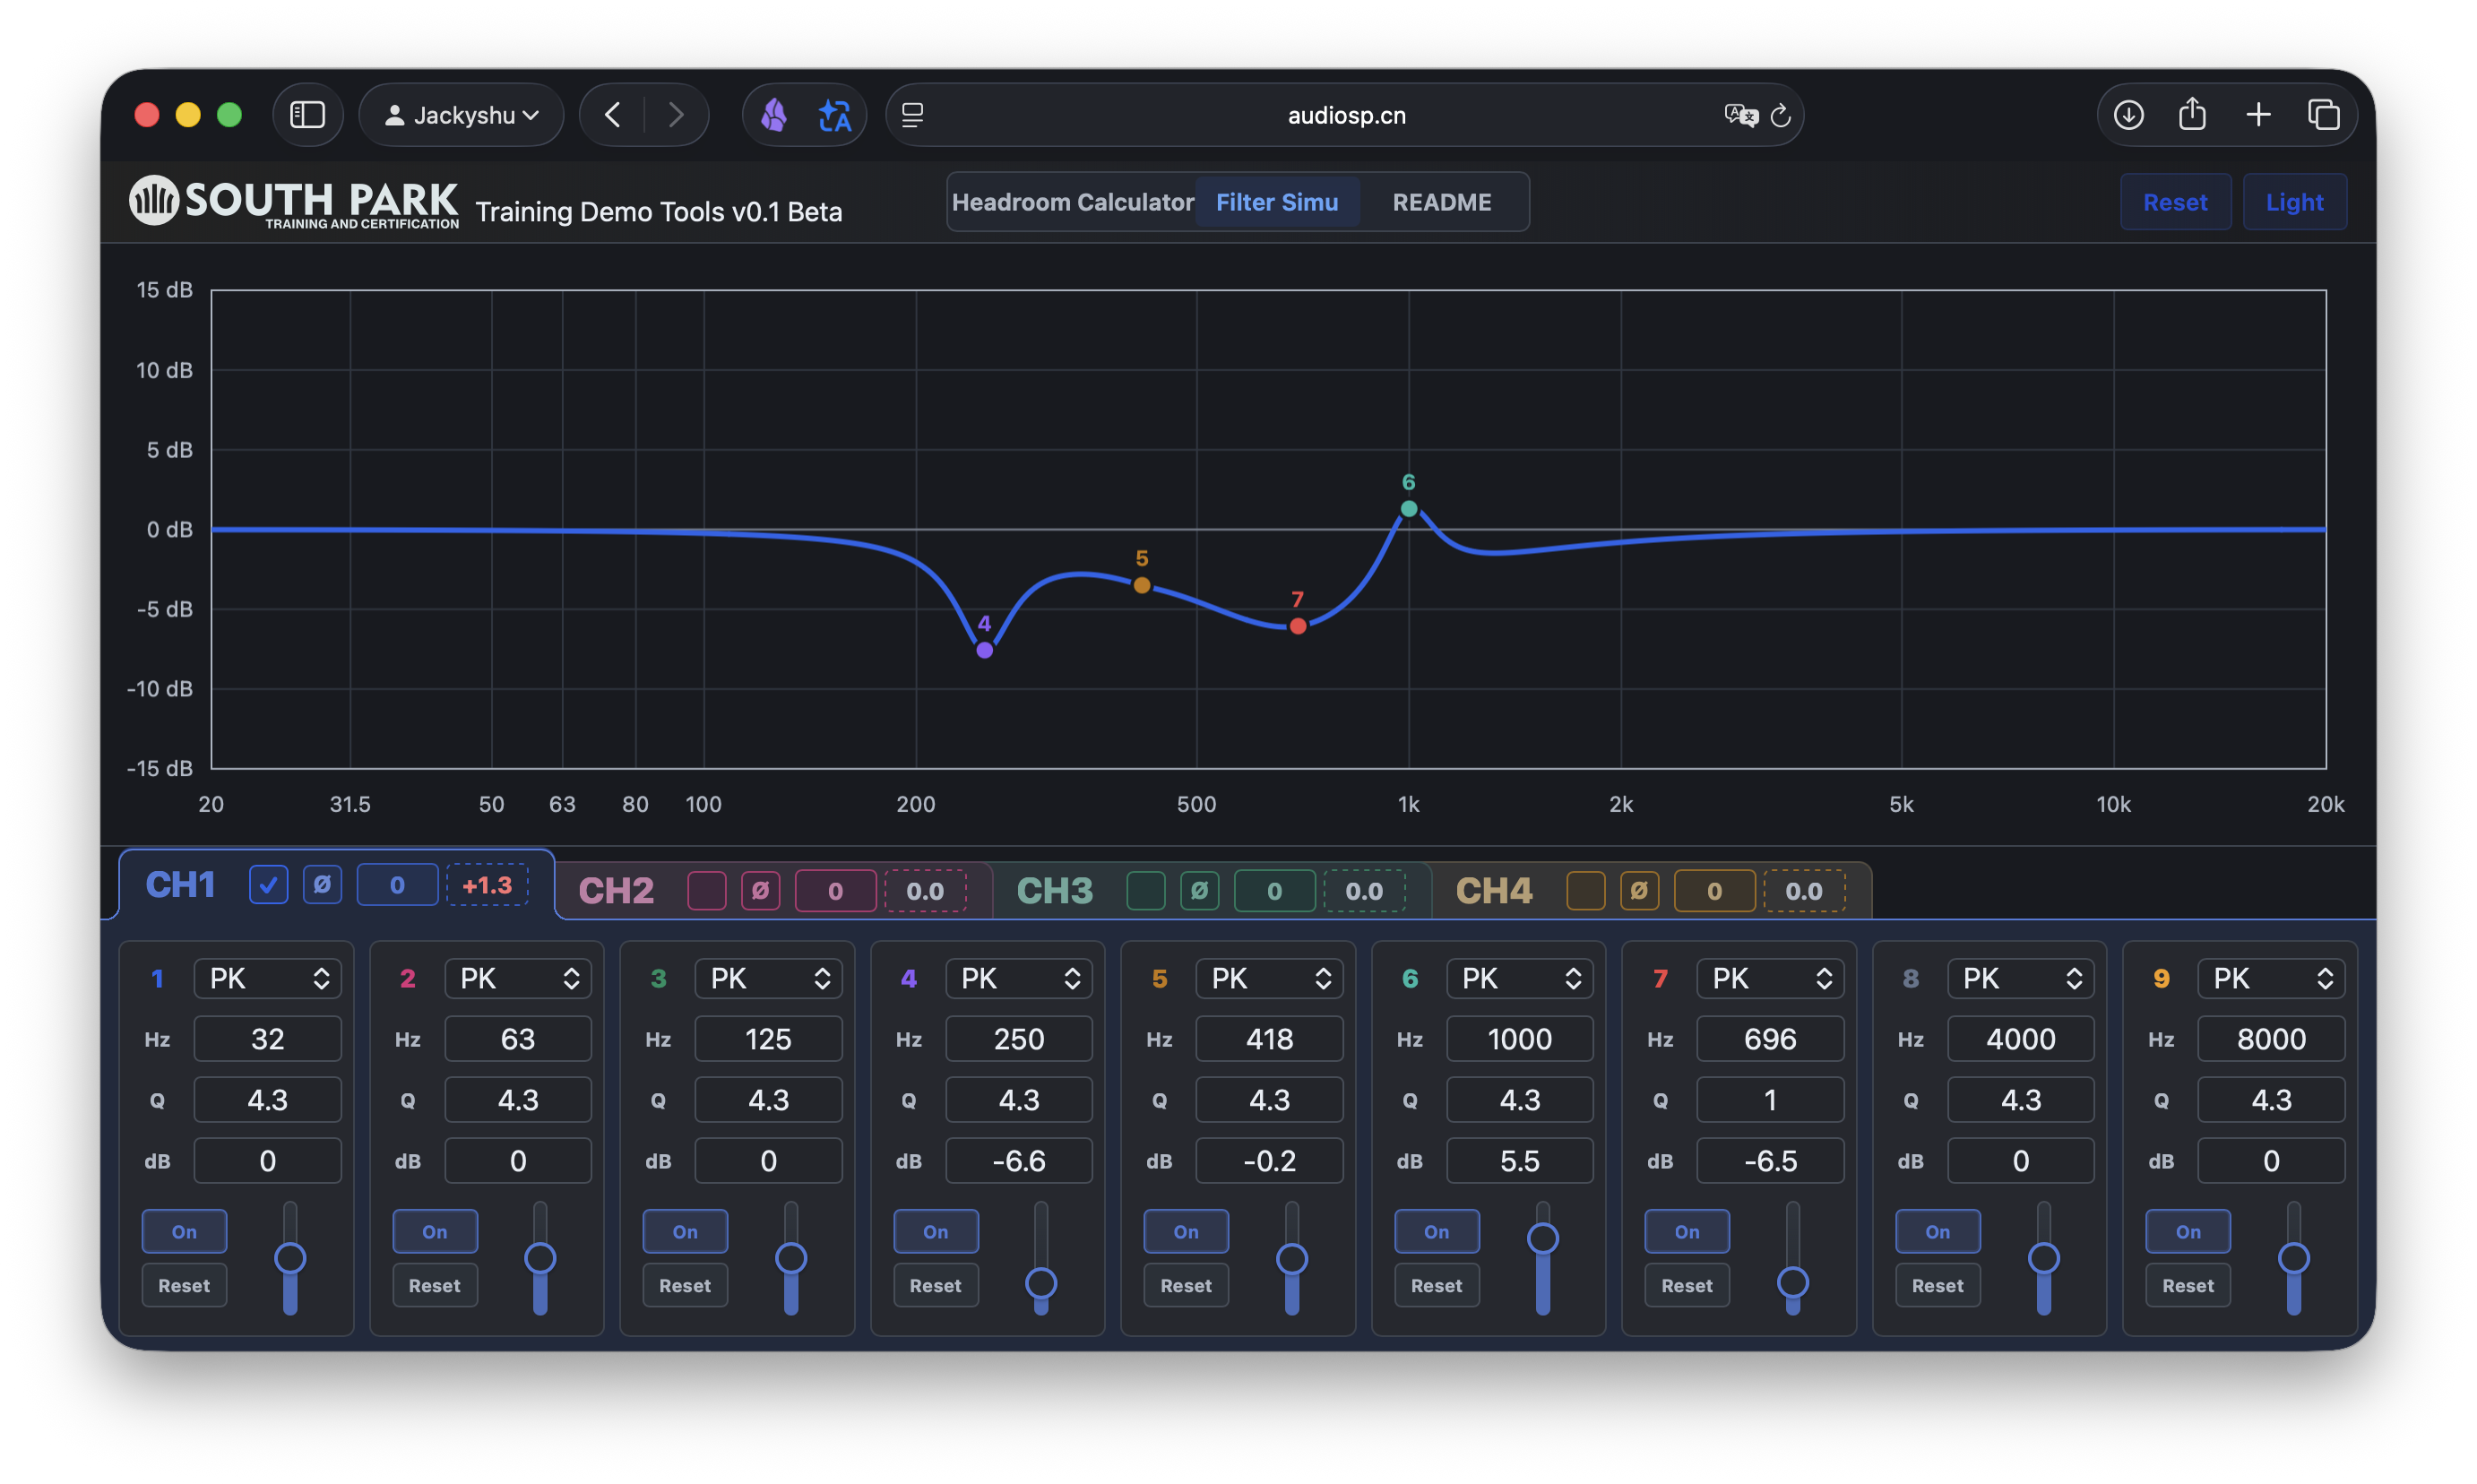
This tool reads EQ configuration data from a MUSWAY DSP. It calculates each channel's crossover and EQ settings, then displays them as a transfer function curve. The curve is calculated from parameters. It is not a microphone measurement.
Why output may not reach the maximum DSP output after crossover and EQ
You can first understand the maximum output of a DSP as the highest analog output voltage it can produce without clipping. But whether one channel can really reach that maximum does not only depend on the hardware. It also depends on the processing before that channel.
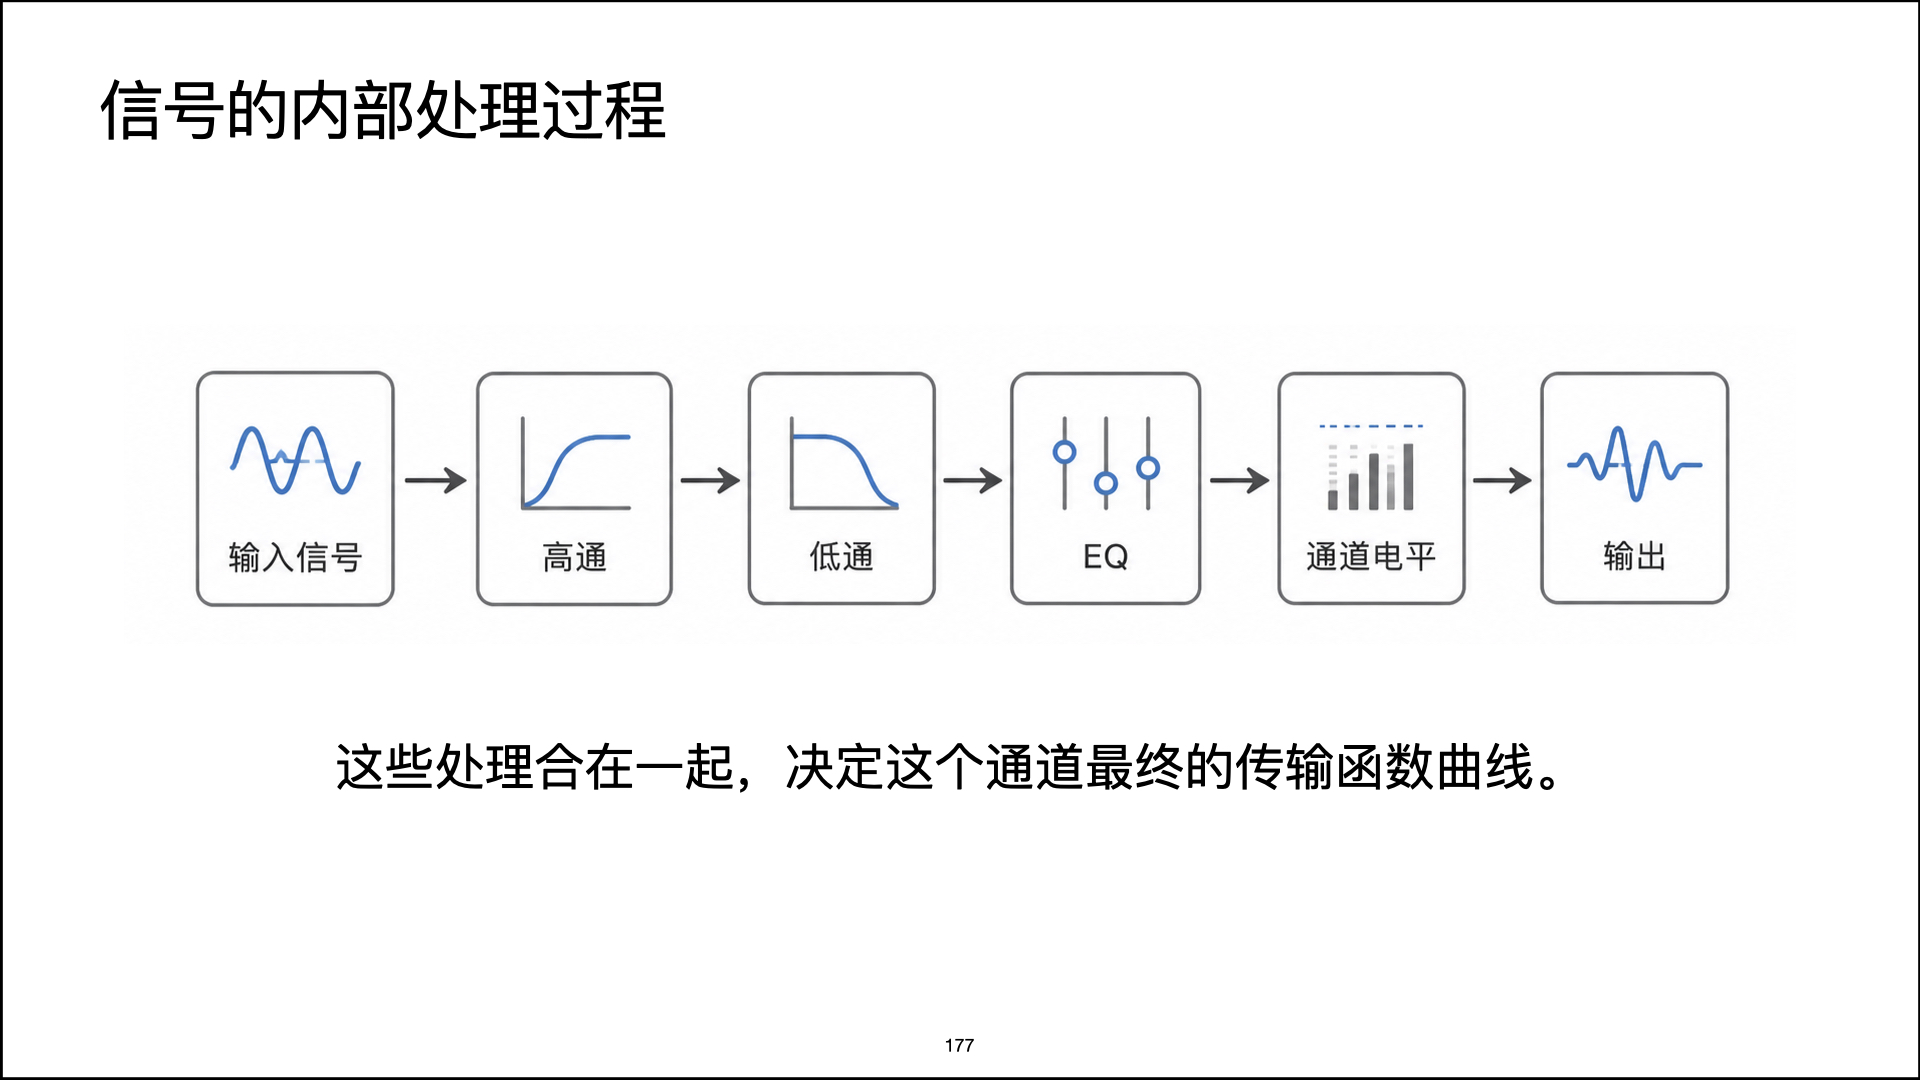
- High-pass filter
- Low-pass filter
- EQ
- Channel level
- Master volume or input level
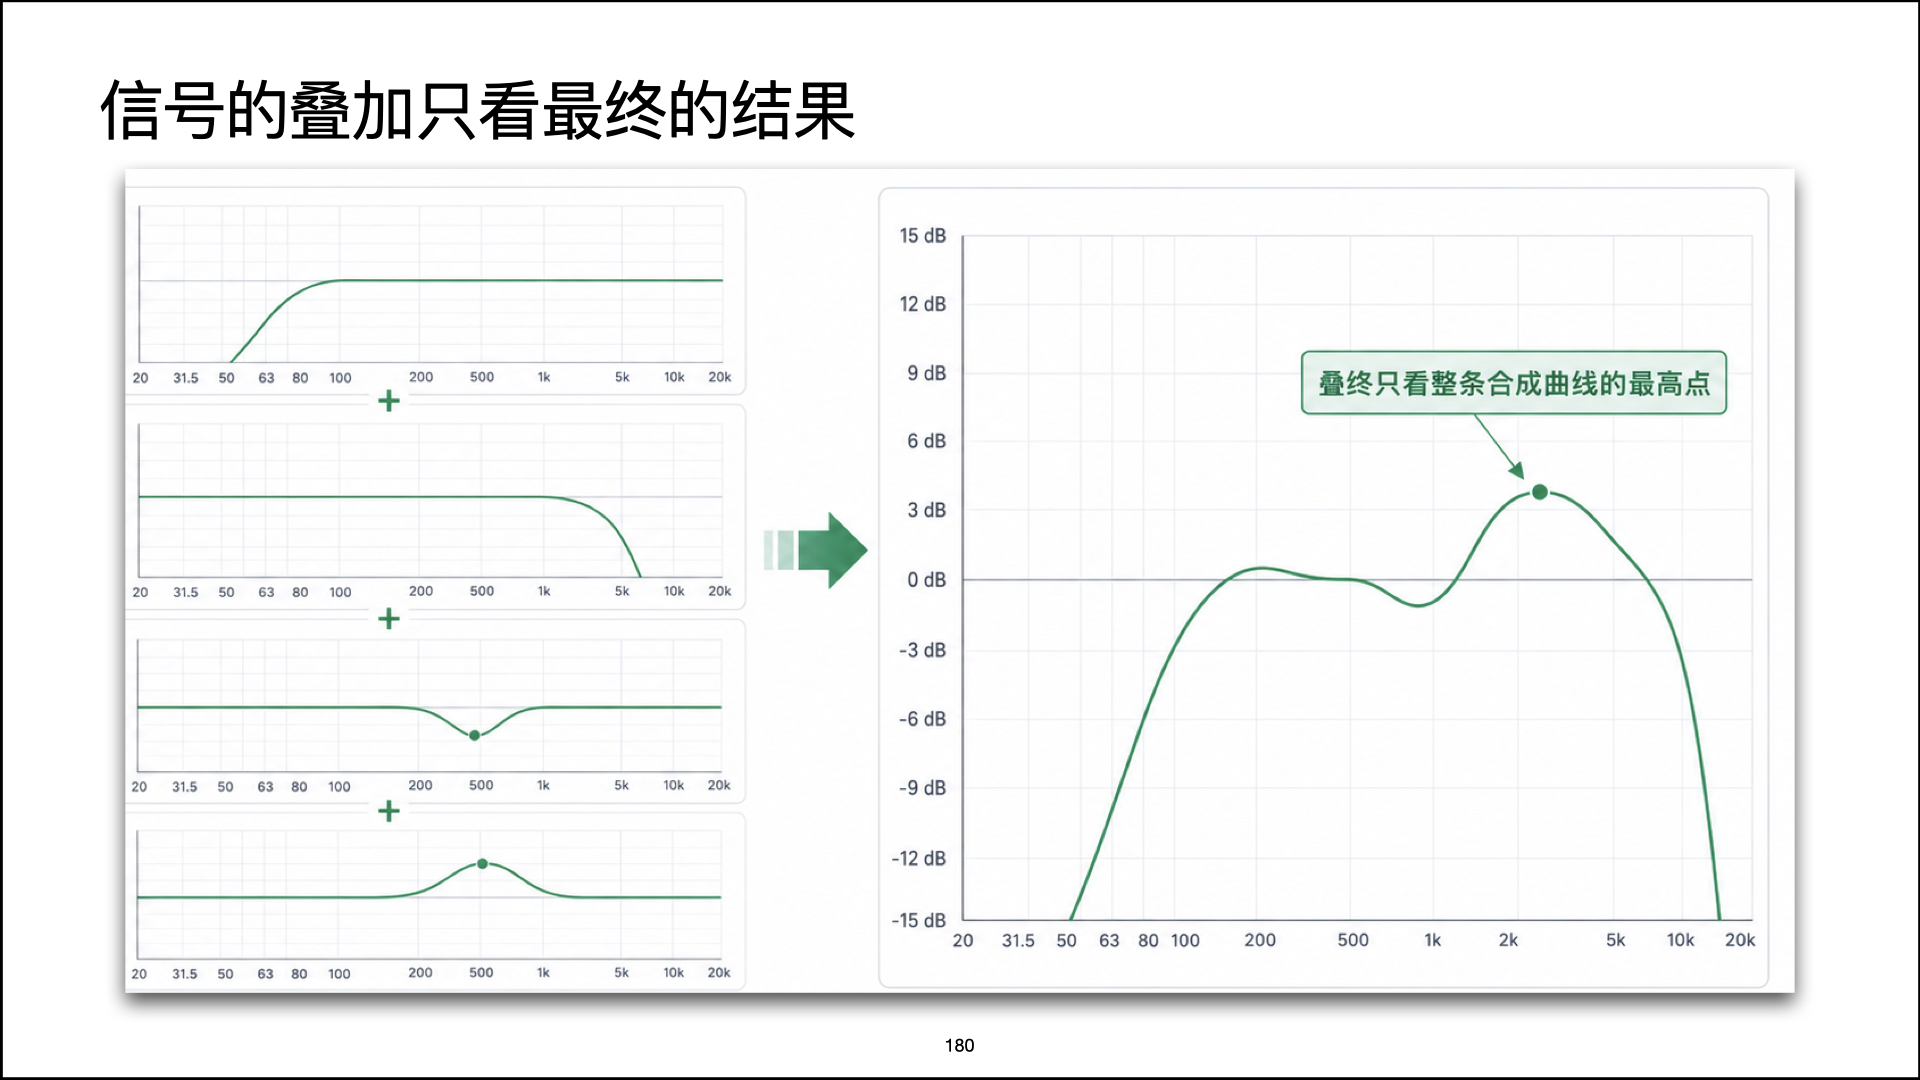
These processing steps combine into one transfer function curve. This curve shows how much the input signal is boosted or reduced at different frequencies.
0 dB and peak gain loss
In this tool, 0 dB can be read as the reference line where the crossover and EQ settings add no extra boost or cut.
If the highest point of a channel curve is exactly 0 dB, the signal can still pass through at its original full level at one frequency.
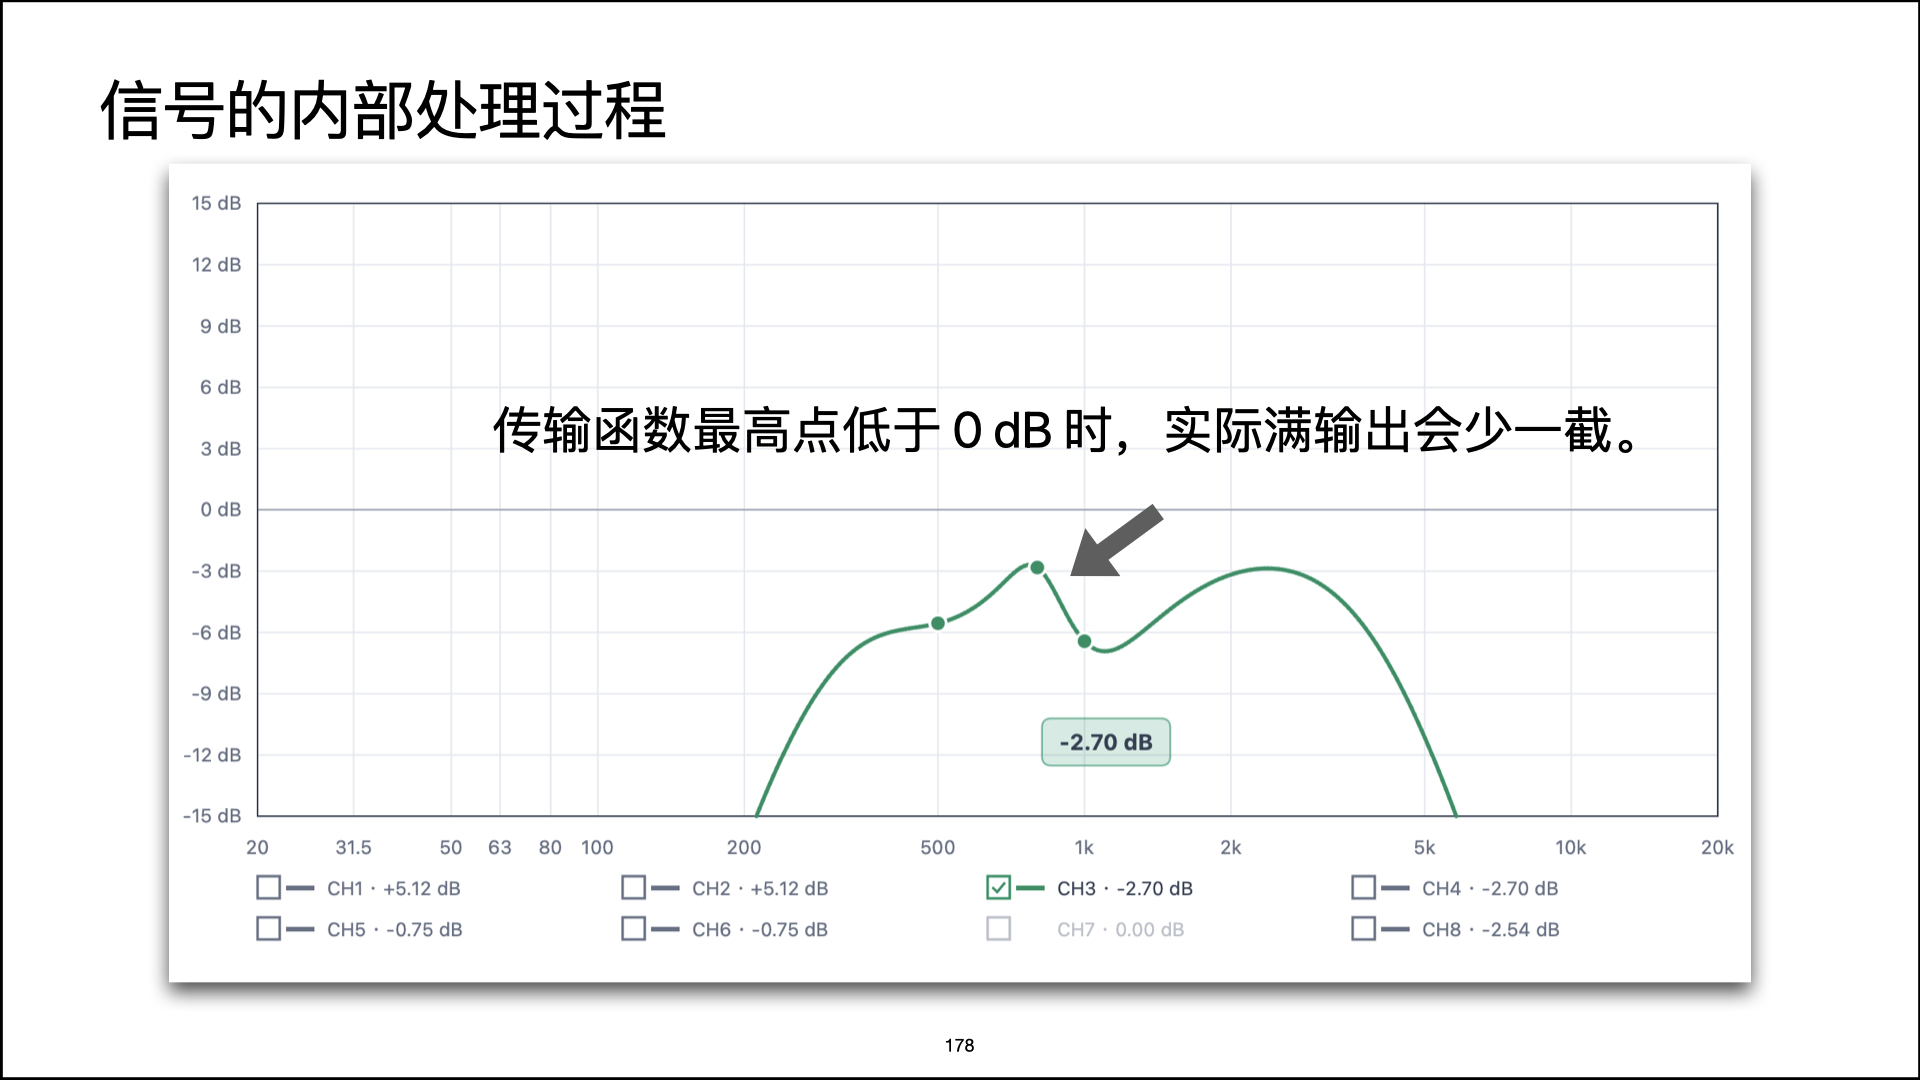
If the highest point of a channel curve is -2.70 dB, then after this crossover and EQ chain, the whole channel's highest level is only
-2.70 dB. The difference between this value and 0 dB is 2.70 dB.
This difference is the peak gain loss of this processing chain compared with 0 dB. In other words, if you want this channel to reach the DSP
maximum output again, you theoretically need to add back this many dB.
Where this difference comes from
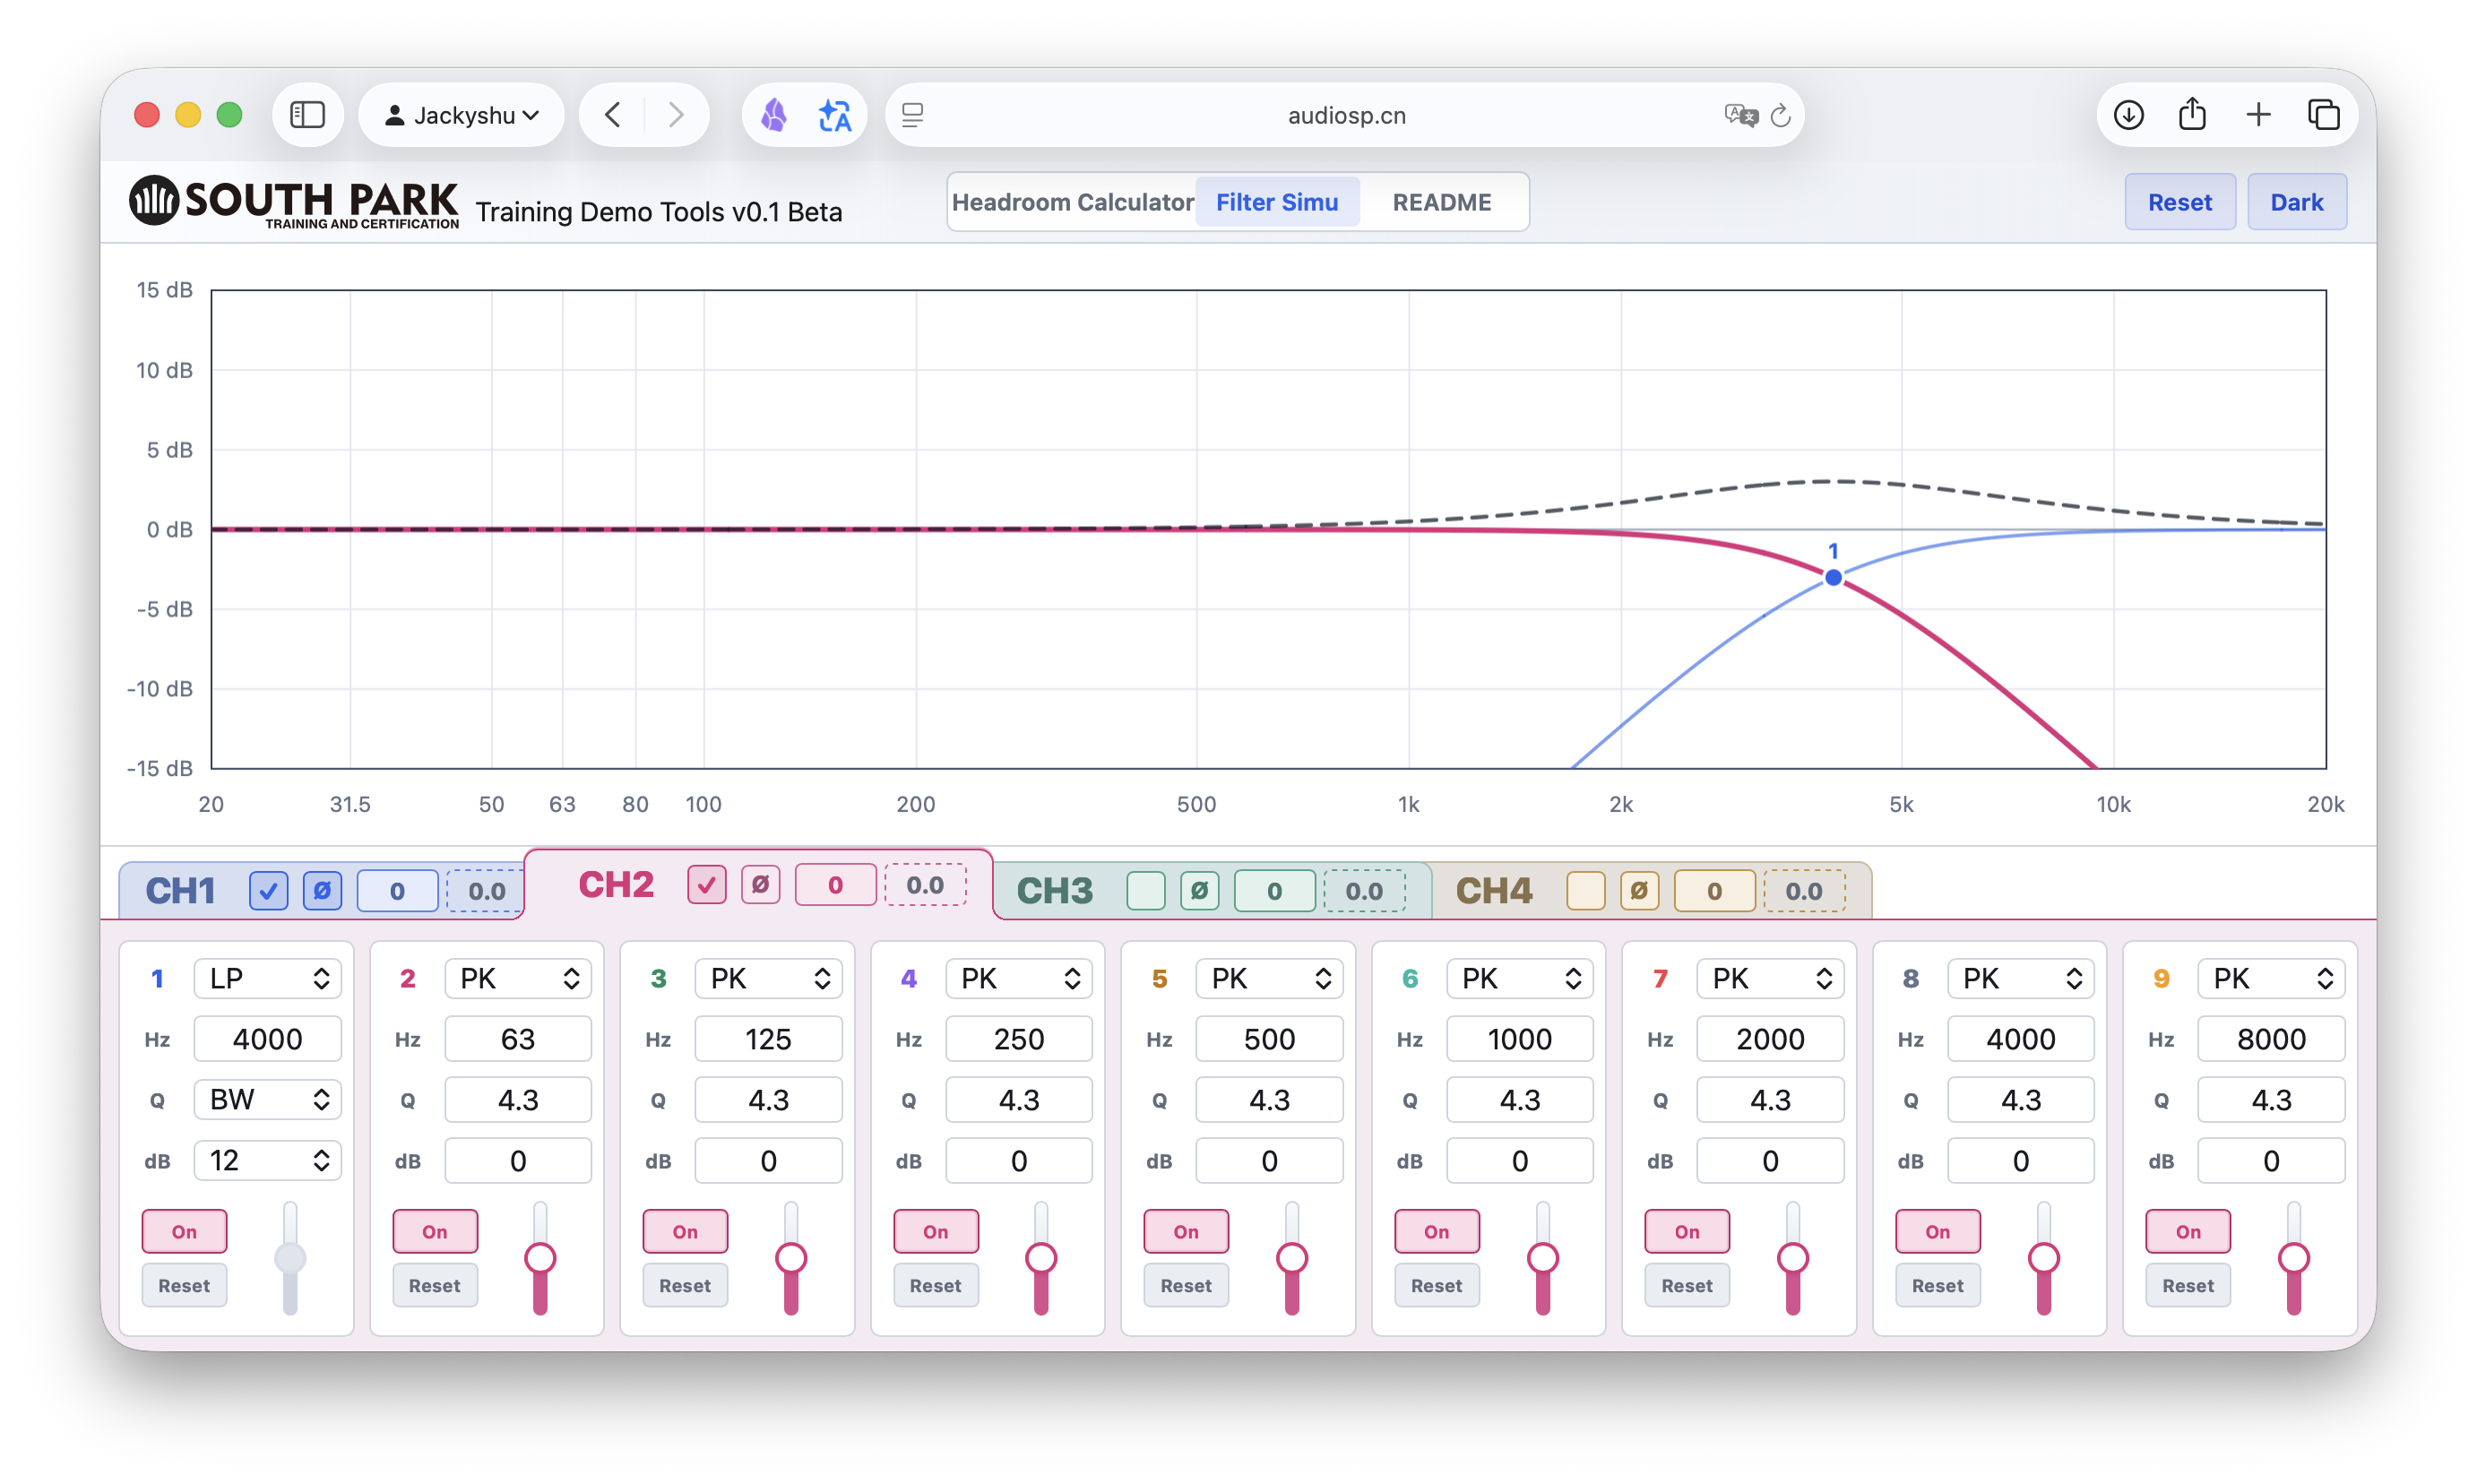
A high-pass filter and a low-pass filter are not simple on/off switches. Near the crossover frequency, they reduce the signal gradually. For example, a midbass channel may have a high-pass filter on the lower side and a low-pass filter on the upper side.
When these two filters are combined, the passband in the middle may not always stay exactly at 0 dB.
If the two crossover frequencies are close, or if the filter type, slope, or DSP implementation is different, the highest point of the combined curve may be lower than 0 dB.
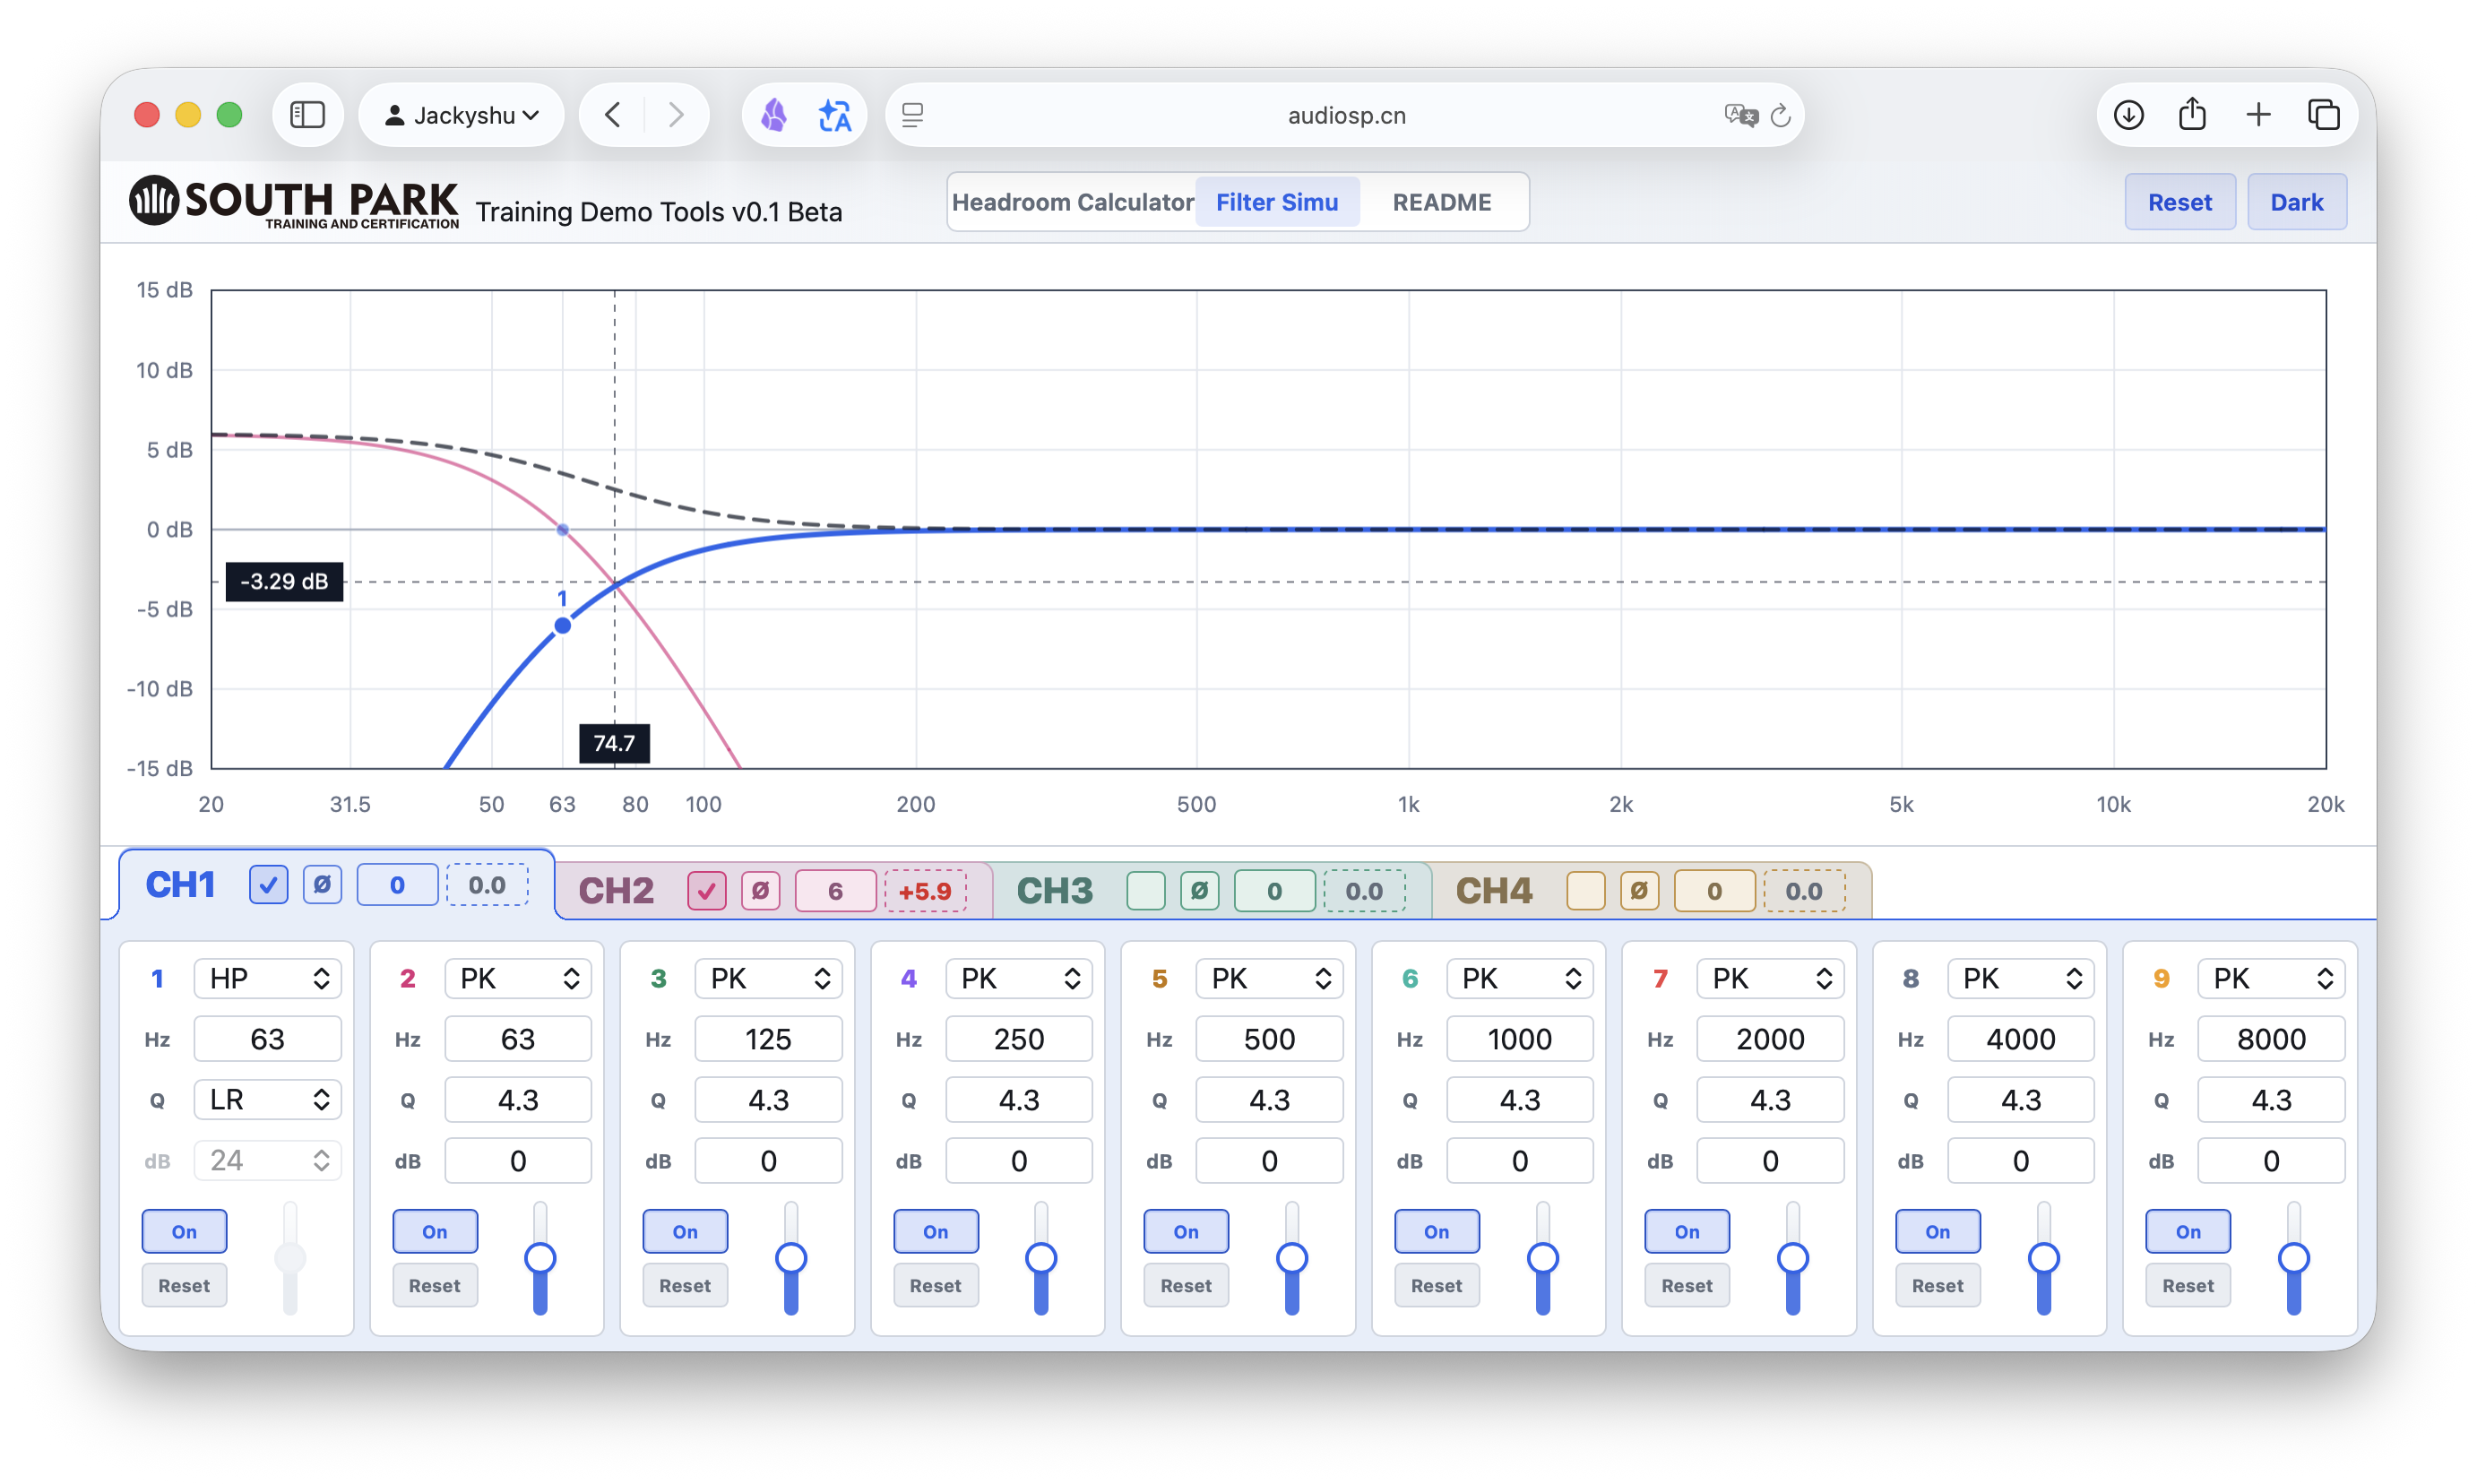
A simple LR4 calculation example
This simplified example uses an LR4 high-pass filter and an LR4 low-pass filter under ideal conditions. EQ is ignored first.
An LR4 high-pass filter under ideal conditions can be approximated as:
An LR4 low-pass filter under ideal conditions can be approximated as:
After the two filters are combined:
Converted to dB:
If we use a 63 Hz high-pass filter and a 300 Hz low-pass filter, the highest point appears around the geometric center:
This means that even without any EQ, an LR4 band-pass under ideal conditions from 63-300 Hz may still have a highest point about 0.75 dB below 0 dB.
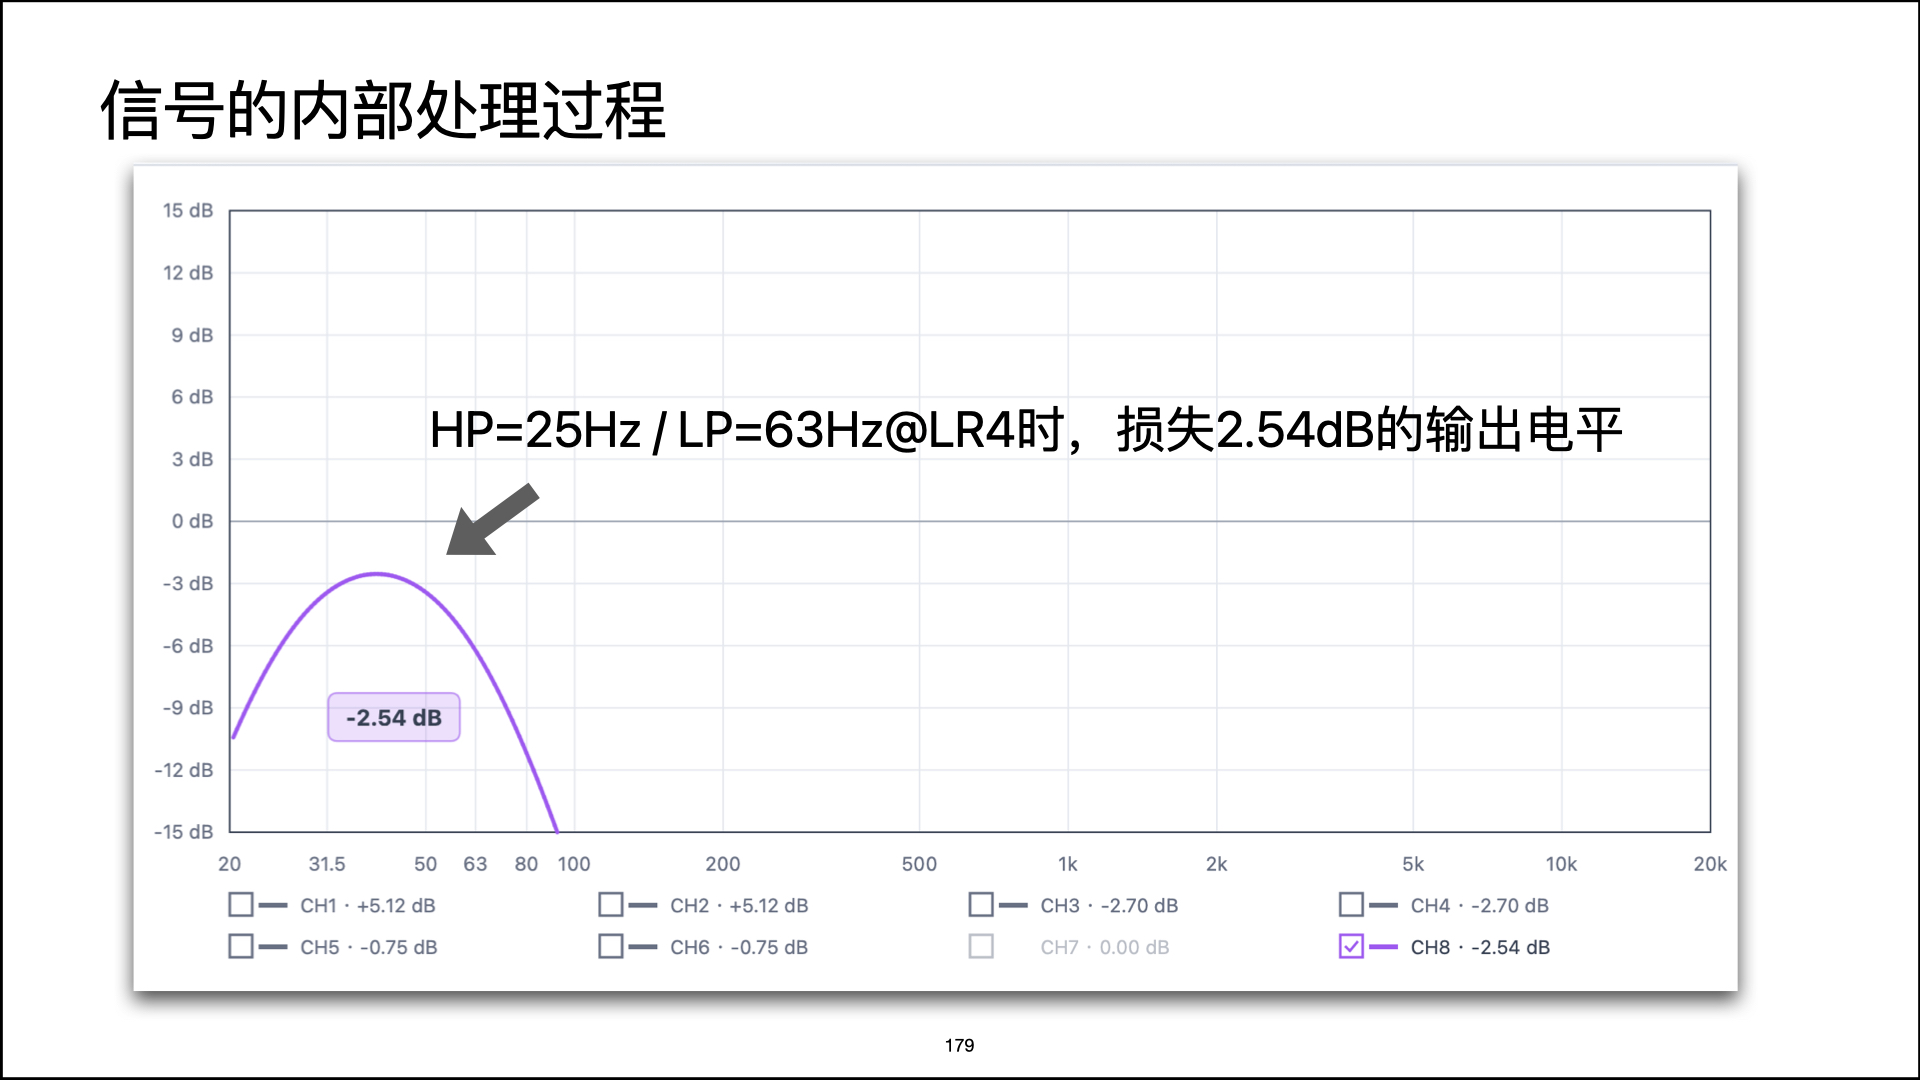
If we change the example to a common subwoofer range such as 25-63 Hz, the crossover points are closer, so the loss is larger, about -2.54 dB.
So 0.75 dB is not a fixed number for every LR4 band-pass. It depends on the distance between the high-pass and low-pass crossover frequencies.
This does not mean the DSP became weaker
Two things must be separated clearly:
- The maximum output of the DSP hardware itself has not changed.
- After this channel passes through the crossover and EQ settings, the highest gain of the processing chain becomes lower.
The hardware can still output that high voltage. But the current settings reduce the signal first. If this loss is not compensated somewhere else, the actual output cannot reach the hardware limit.
How to read the dB label in this tool
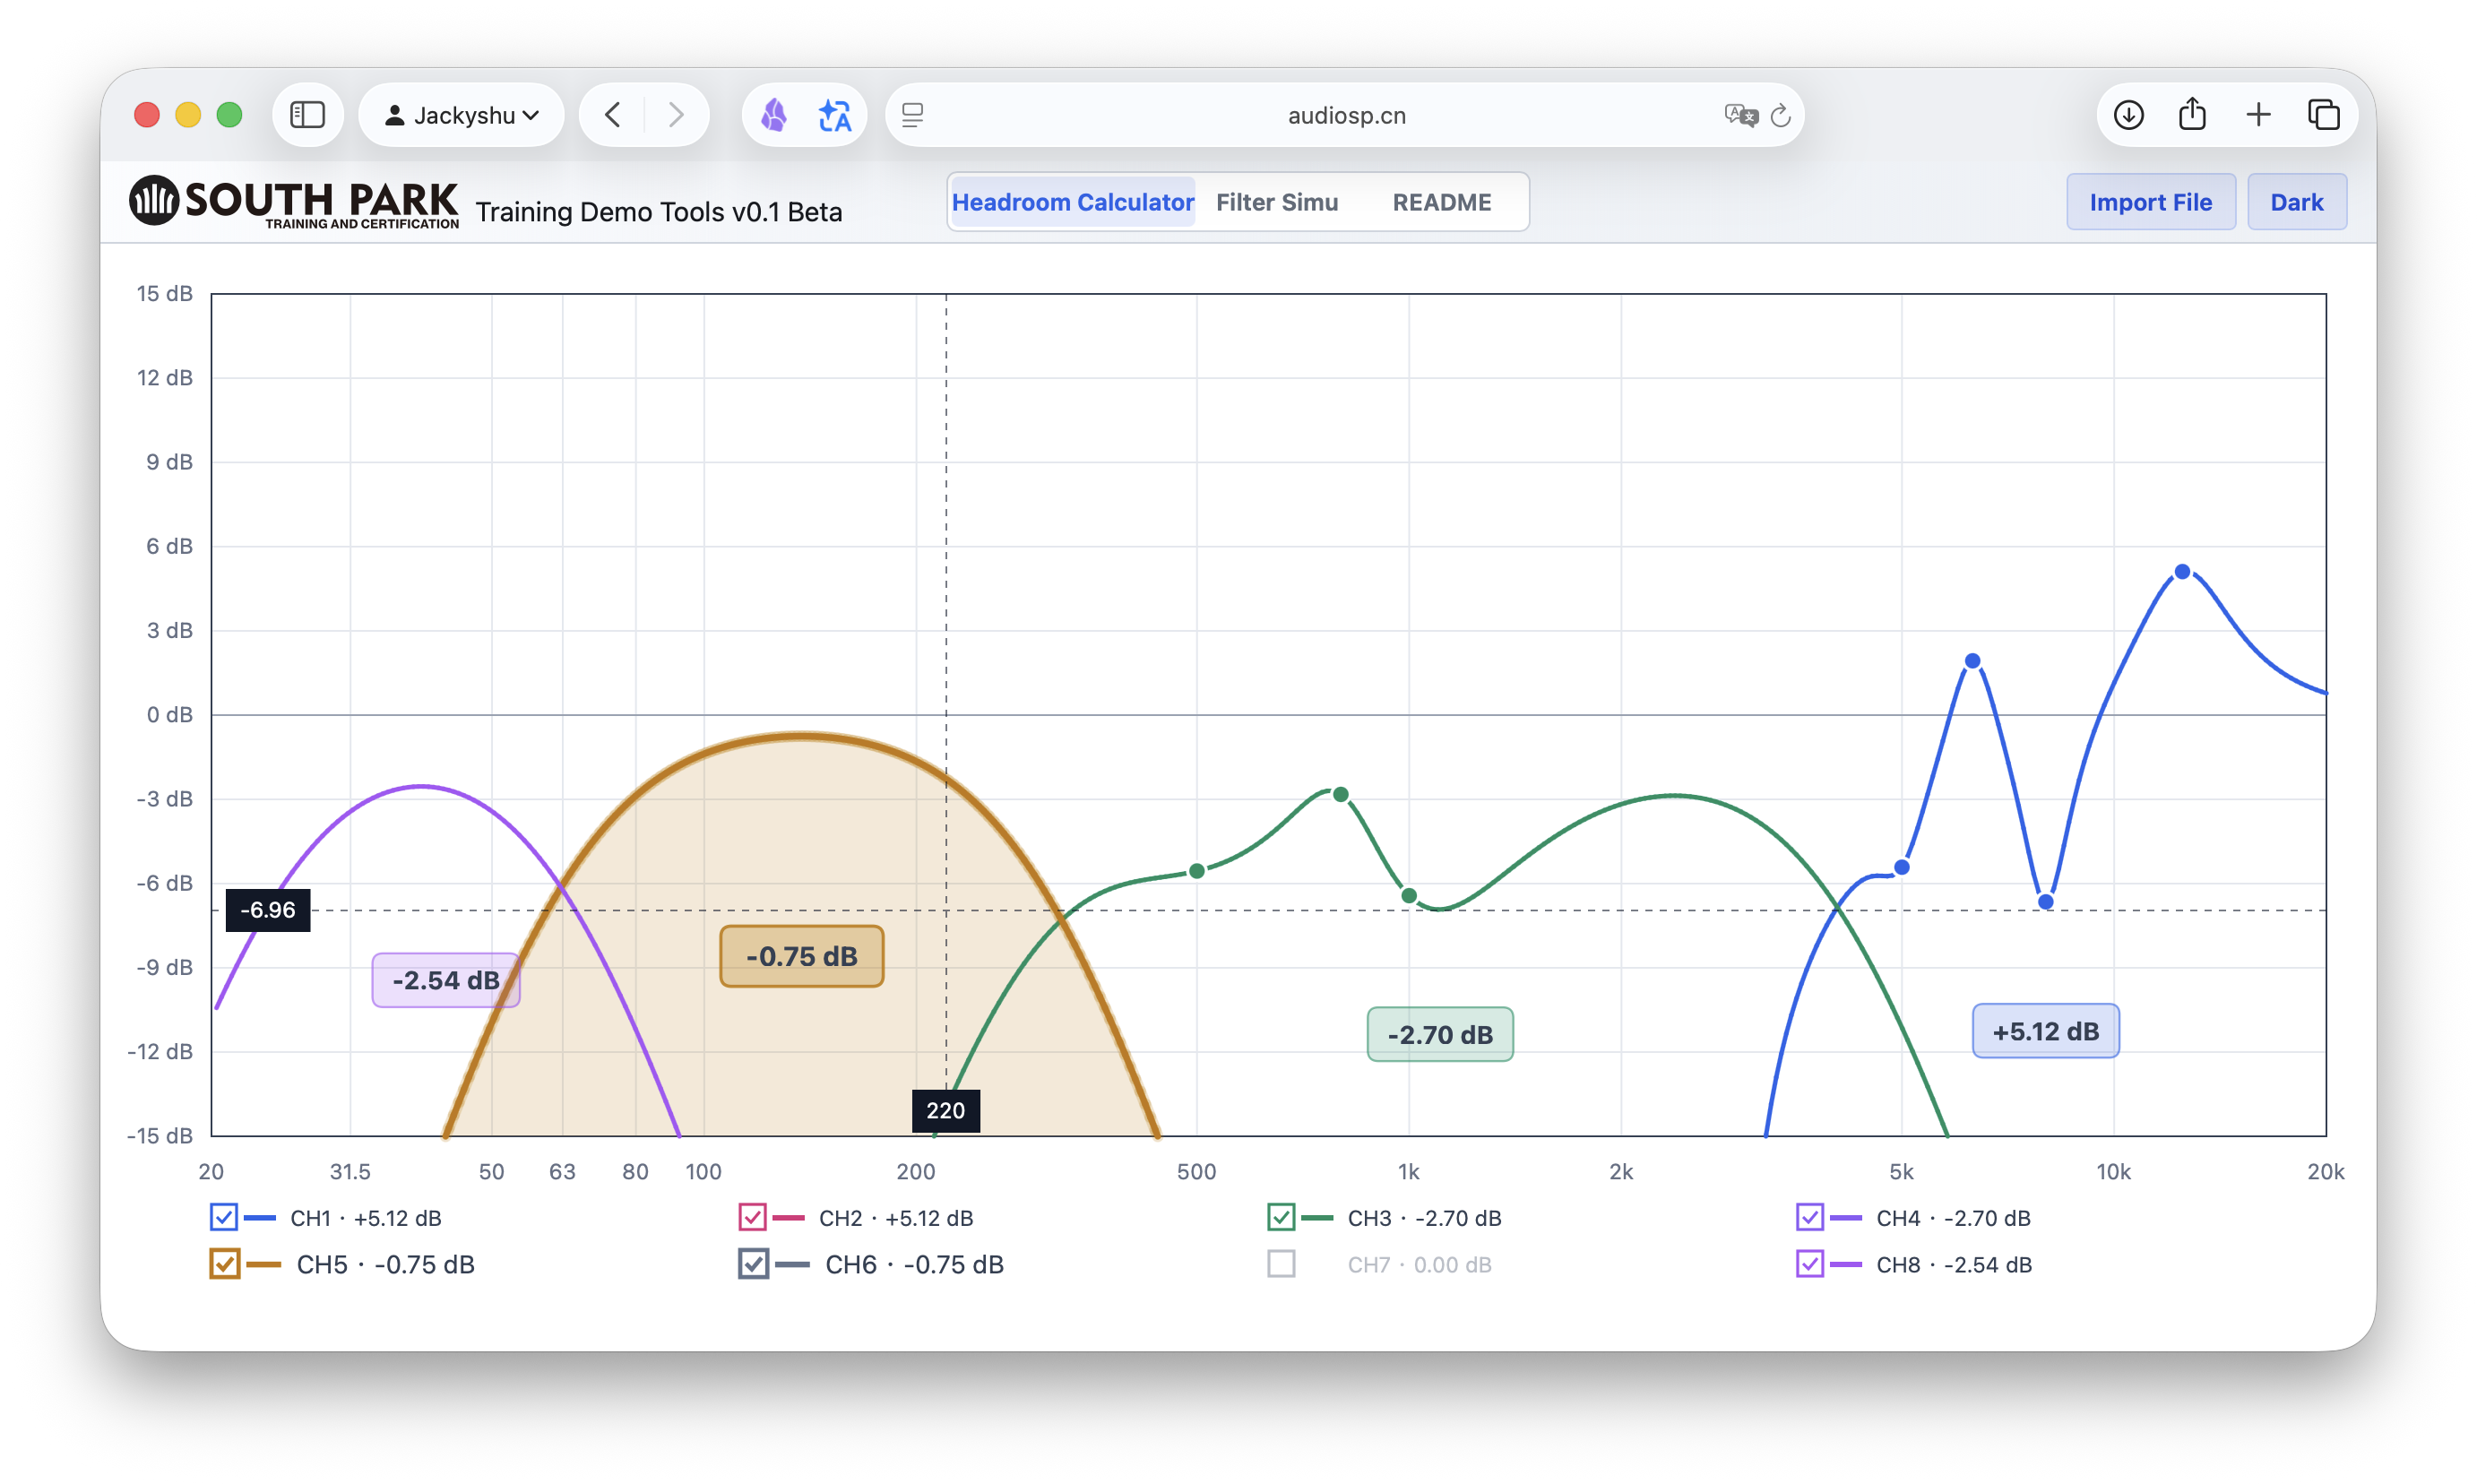
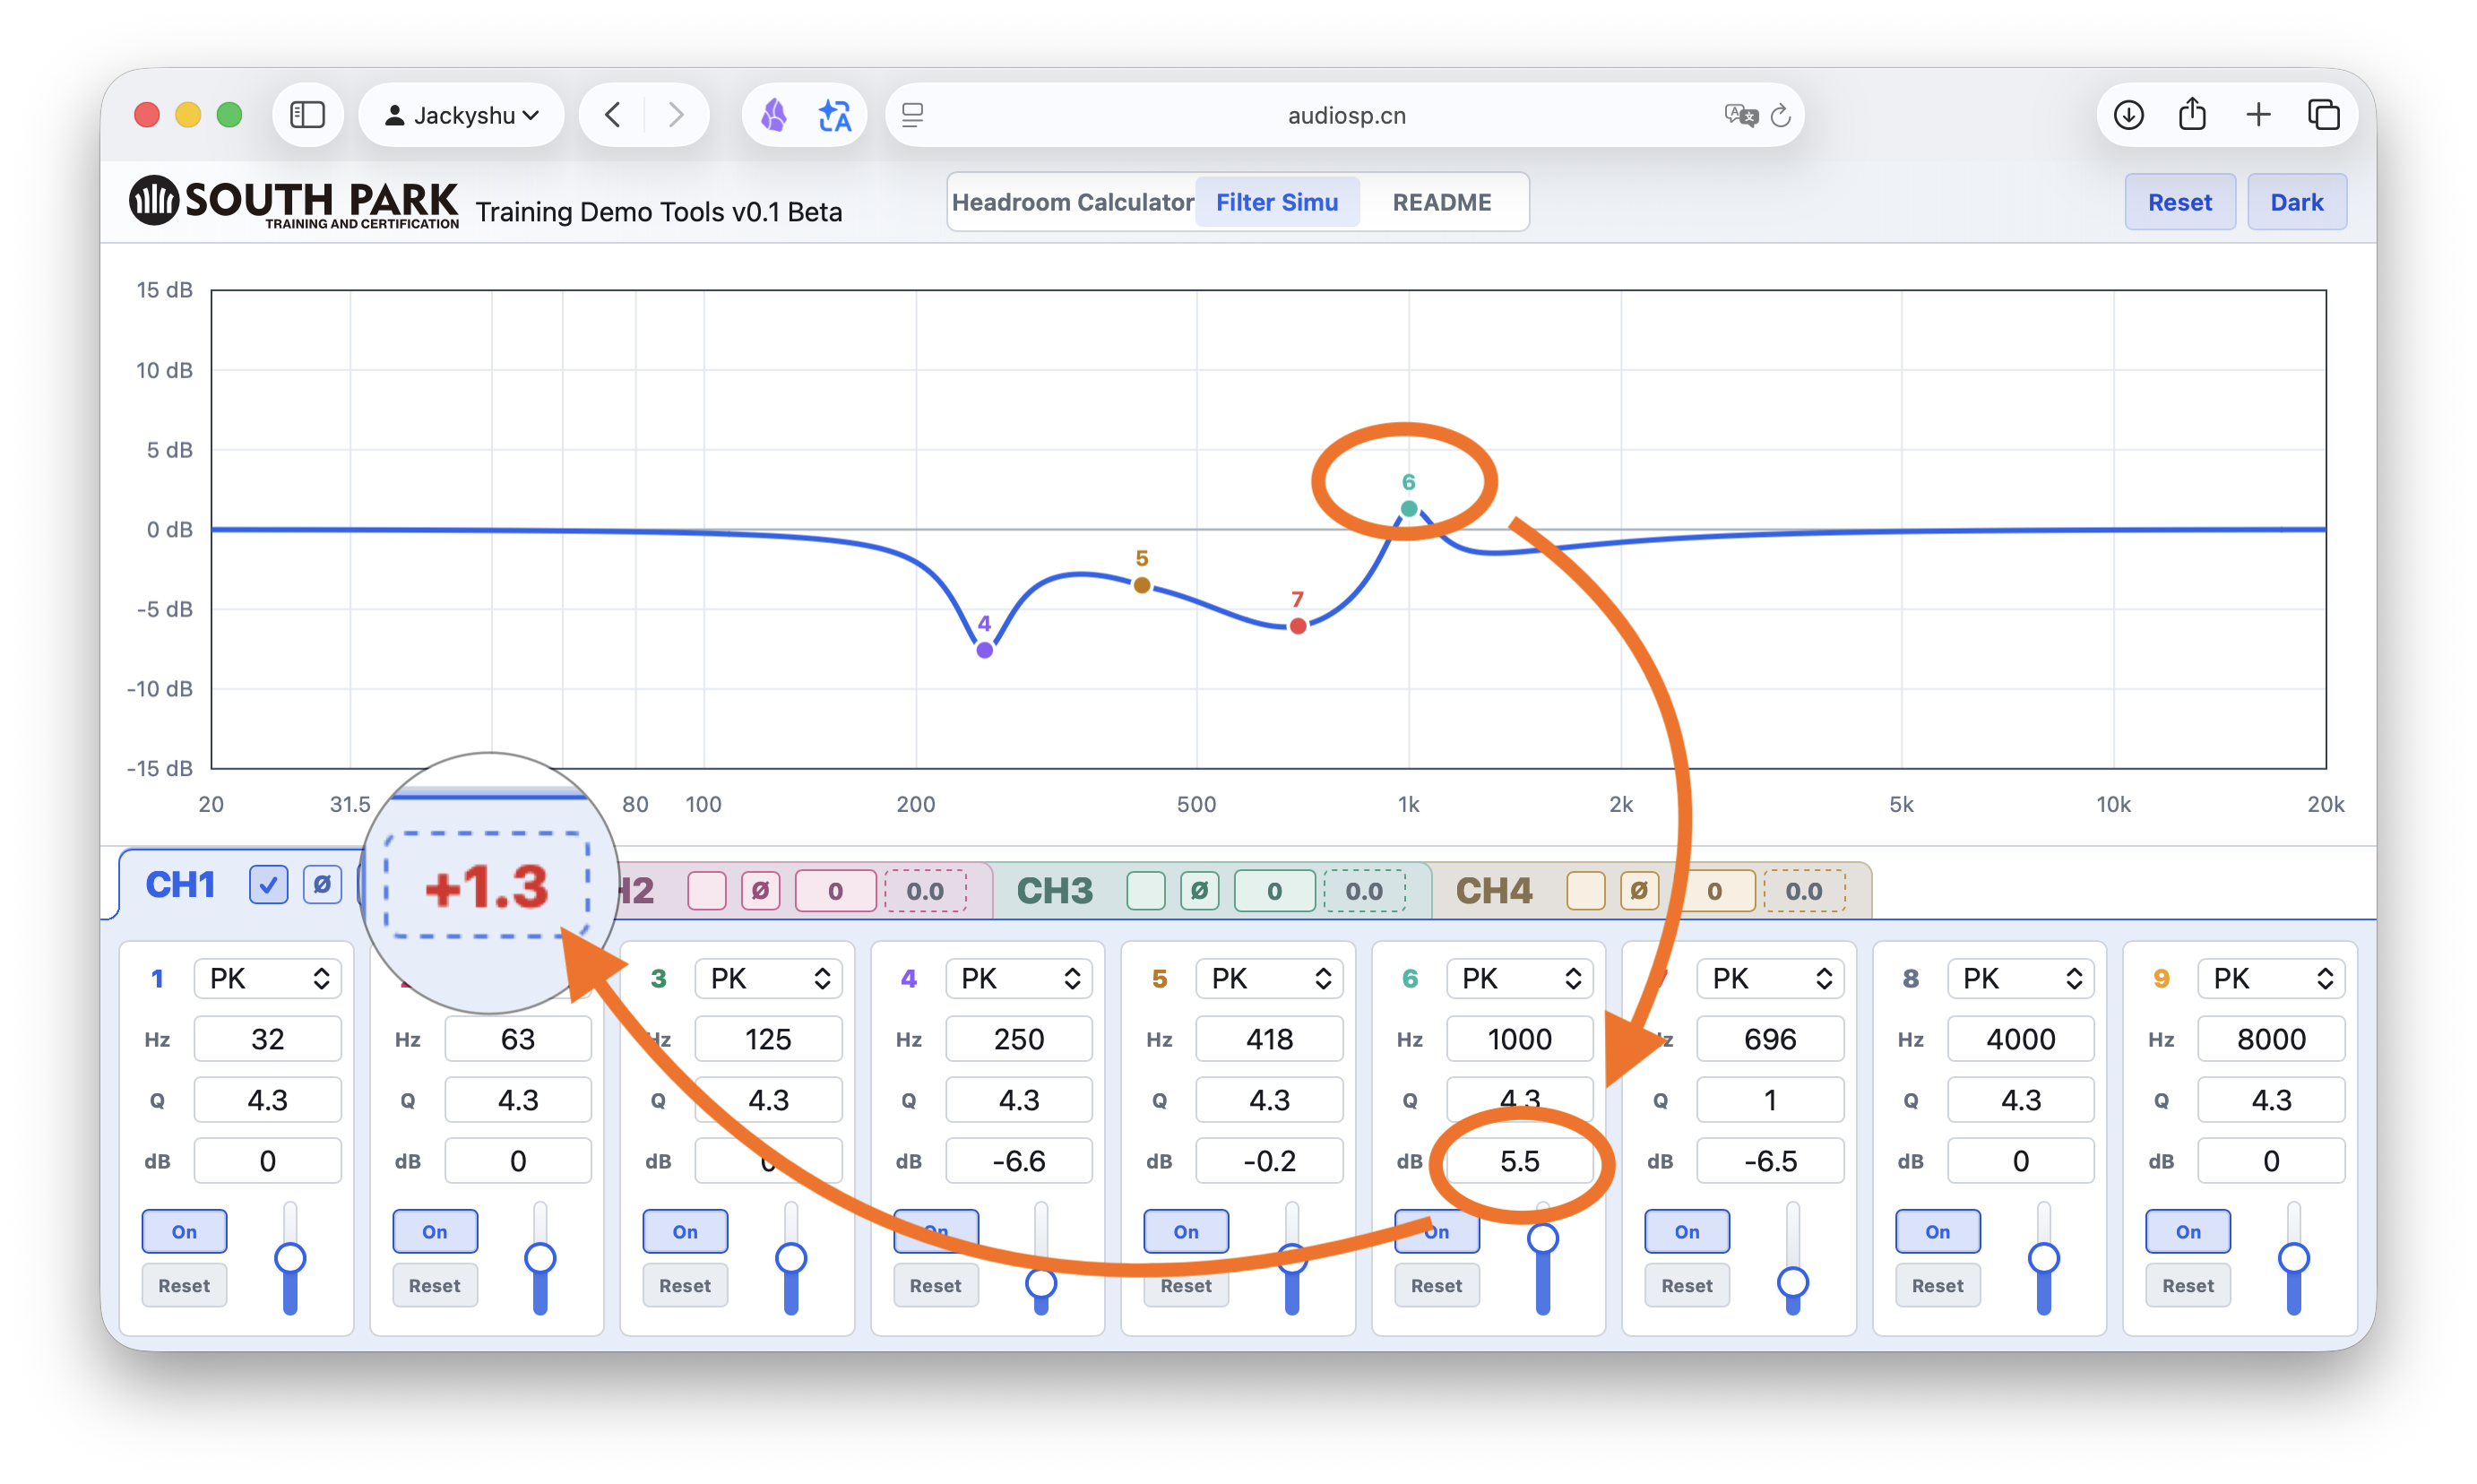
The dB label in the curve area helps you judge the relationship between the highest point of this channel's transfer function and 0 dB.
- Negative number
- The highest point is below
0 dB. Compensation is needed if you want it to reach full output again. - Around 0 dB
- The highest point is close to the reference full level.
- Positive number
- The processing chain has boost. You may need to watch for clipping risk.
What can we do?
Because of the current MUSWAY design, it does not reserve extra headroom for this situation in the same way as some other DSP brands. These are the workaround methods I use for reference:
- Use the built-in HS / LS filters in MUSWAY to change the level of the whole band-pass area. This is not very exact, but in most cases it is good enough.
- During level matching, use a
-10 dBor-6 dBsine wave signal instead of the common0 dBsine wave signal to get extra headroom at this stage.
Some DSP brands set the default level at 0 dB and still reserve an extra 3-6 dB of boost range.
This is flexible, but inexperienced users may also cause clipping distortion if it is used incorrectly.
Load and view channels
Click Import File, then choose a local file. The tool currently supports two types of content:
- MUSWAY JSON configuration files
- Plain frequency / gain text
Plain text example:
20 -6
31.5 -4.5
63 -2
100 0
1000 0
10000 -3
20000 -6
Units can also be included:
20 Hz, -6 dB
100 Hz, 0 dB
1000 Hz, 1.5 dB
After import, the tool reads the data and displays all output channels. By default, it only shows channels that have valid data. If a channel has no crossover and no valid EQ, the legend still shows the channel name, but the text is gray and the checkbox cannot be selected.
Current calculation rules
zy=150is treated as0 dB.- EQ gain is converted by
(150 - zy) / 10. - Q value is converted by
qz / 100. lx=0is temporarily calculated as Peak / Peaking EQ.gq_plis temporarily calculated as the high-pass frequency.dq_plis temporarily calculated as the low-pass frequency.*_xl=4is temporarily calculated as LR4 / 24 dB/oct crossover.*_xl=0is temporarily treated as this crossover being turned off.
These rules are inferred from the current sample file and software screenshots. They still need to be verified with more MUSWAY files later.
Common questions
Why do two channels show only one curve?
If two channels have exactly the same crossover and EQ settings, their curves overlap completely. The tool automatically draws only one curve to avoid covering the same curve again.
Why is an EQ point not always at the highest or lowest point?
The curve is the result of several factors combined, including the current EQ point, other EQ points, high-pass crossover, and low-pass crossover.
Why are some channels gray?
This channel has no valid crossover and no valid EQ adjustment. The tool still keeps the channel name so you can confirm that this channel exists in the configuration file.
Is this a measured frequency response?
No. The current curve is a theoretical transfer function curve calculated from DSP configuration parameters. It can help you understand level changes caused by crossover and EQ, but it cannot replace a microphone measurement.
One More Thing
Filter Simu is a teaching feature that is still under development. It is mainly used in my tuning training course to explain different filter behaviors.
If you have any questions, please email me: jackyshu@gmail.com